Overview
Gene expression begins at promoters — regions of DNA that recruit the transcriptional machinery to the correct starting position. Identifying these regions computationally is a foundational problem in genomics, with direct applications to gene annotation, regulatory network reconstruction, and understanding disease-associated variants in non-coding DNA. This project builds a complete pipeline that takes raw DNA sequences, encodes them as k-mer frequency vectors, and classifies them as promoter or non-promoter using three machine learning models spanning a complexity spectrum: Logistic Regression (linear), SVM with RBF kernel (non-linear), and Random Forest (ensemble). Beyond classification accuracy, the focus is on connecting the learned features back to known promoter biology through feature importance analysis.
Background
Human promoters come in two major flavours. About 25–30% contain a
TATA box (consensus sequence TATAAA) roughly 30 base
pairs upstream of the transcription start site (TSS), and these tend to drive
tissue-specific gene expression. The remaining ~70% are TATA-less
and are instead associated with CpG islands — regions enriched in
CG dinucleotides that are typically found at housekeeping genes expressed across all
cell types. Both architectures produce distinctive sequence composition signatures
that can be captured by counting short subsequences (k-mers).
K-mer frequency encoding is a bag-of-words representation borrowed from natural language processing: just as a document can be represented by word frequencies, a DNA sequence can be represented by the frequencies of all possible subsequences of length k. For k=3, this produces 43 = 64 features per sequence. The approach is simple, interpretable, and serves as a strong baseline before moving to more complex representations like convolutional or attention-based architectures.
Approach
The pipeline is built end-to-end in Python with scikit-learn and consists of four stages:
- Data acquisition: 16,455 experimentally validated human promoter sequences from the Eukaryotic Promoter Database (EPDnew), each spanning 300 bp around the TSS. Negative sequences are generated synthetically with GC-content matching to prevent the model from exploiting nucleotide composition as a classification shortcut.
- Feature encoding: Each sequence is converted to a 64-dimensional 3-mer frequency vector via a sliding window. Frequencies are normalized so each vector sums to 1.0, making sequences of different lengths comparable.
- Model training: Three classifiers are trained with 5-fold stratified cross-validation and hyperparameters tuned via GridSearchCV. All models are wrapped in scikit-learn Pipelines with StandardScaler to prevent data leakage.
- Evaluation and interpretation: Models are evaluated once on a held-out test set (20%) using accuracy, precision, recall, F1, and ROC-AUC. Feature importance is extracted from Logistic Regression coefficients and Random Forest Gini importance, then cross-referenced with known promoter biology.
Results
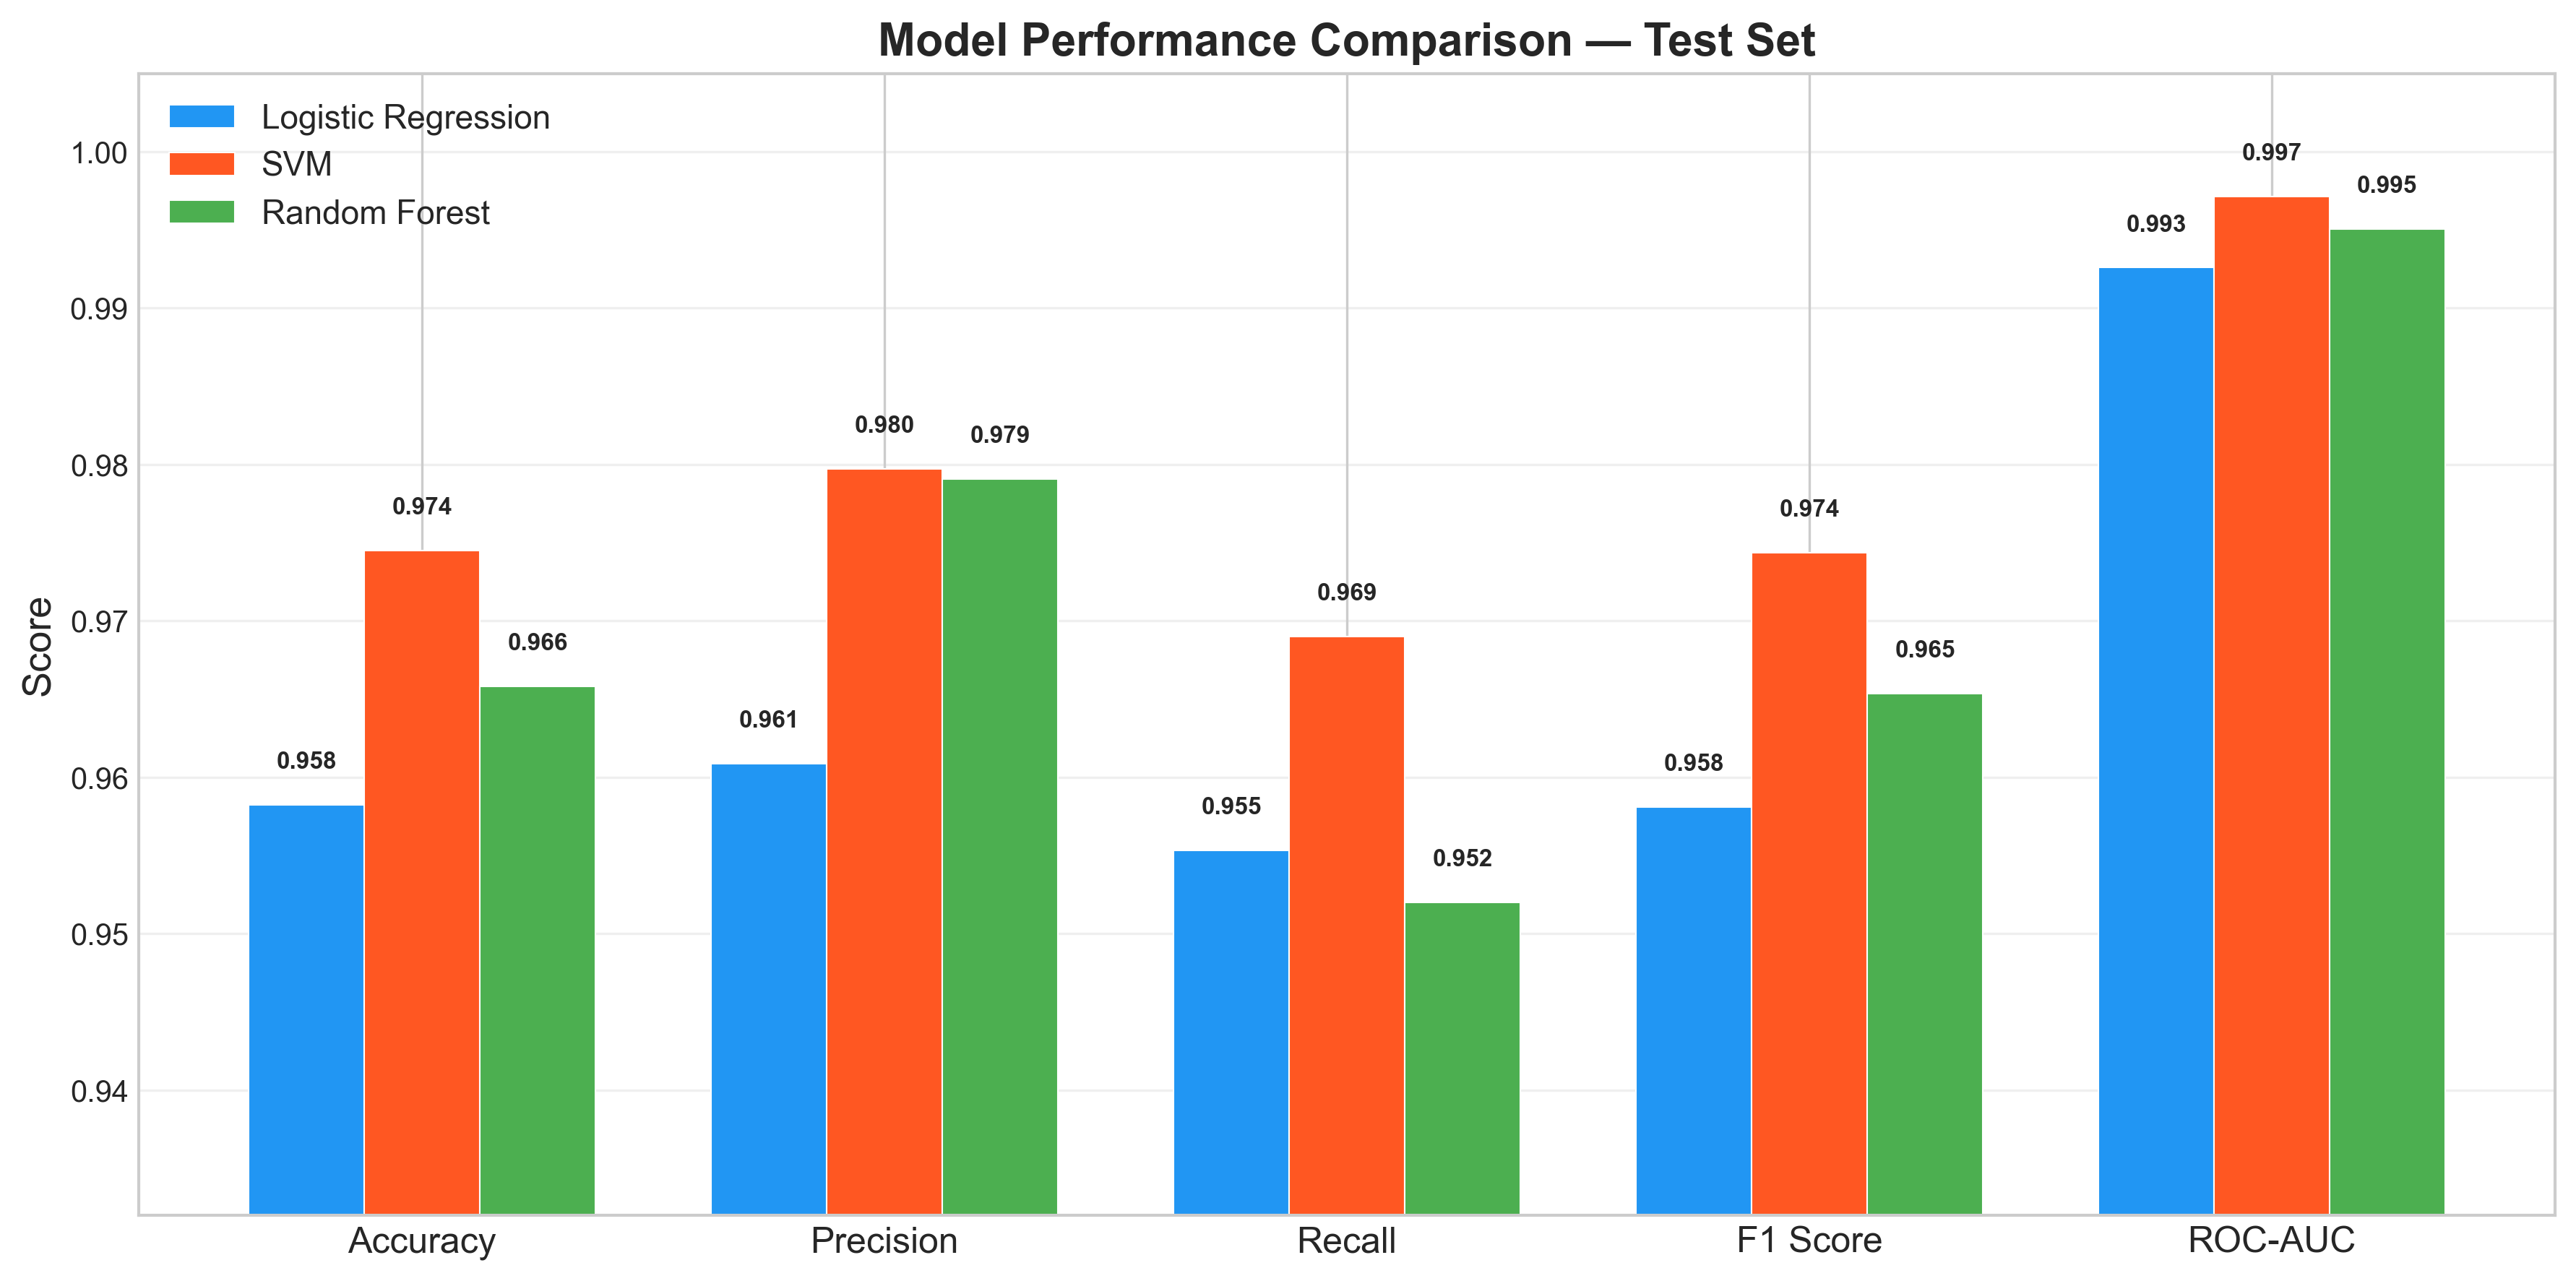
All three models achieved strong classification performance, with SVM (RBF kernel) leading at 97.4% F1 and 0.997 ROC-AUC. The fact that even the simplest model (Logistic Regression) reached 95.8% F1 indicates the problem is largely linearly separable in k-mer space, with a small non-linear component that the RBF kernel exploits.
| Model | Accuracy | Precision | Recall | F1 Score | ROC-AUC |
|---|---|---|---|---|---|
| Logistic Regression | 0.958 | 0.961 | 0.955 | 0.958 | 0.993 |
| SVM (RBF) | 0.974 | 0.980 | 0.969 | 0.974 | 0.997 |
| Random Forest | 0.966 | 0.979 | 0.952 | 0.965 | 0.995 |
Feature importance analysis revealed CG-containing k-mers (ACG, CGA, CGT, TCG, GCG) as the most discriminating features across both Logistic Regression and Random Forest — consistent with the central role of CpG dinucleotides in promoter biology. Notably, GCG carried a positive coefficient toward promoter in the Logistic Regression model, potentially reflecting GC-box motifs that serve as SP1 transcription factor binding sites in proximal promoter regions. AAA and TTT also showed strong positive associations with promoters, consistent with TATA box and other AT-rich functional elements.
An unexpected finding emerged from the coefficient directionality: most CG-containing k-mers pointed toward the non-promoter class. This reflects the fact that real genomic DNA — including promoters — carries evolutionary CpG depletion due to cytosine methylation and spontaneous deamination. The synthetic negative sequences, lacking this mutational history, retain CG dinucleotides at the frequency expected from base composition alone. The model is therefore partially learning to distinguish real from synthetic DNA, not purely promoter-specific biology.
Limitations & Future Work
The reported performance likely represents an upper bound. The synthetic negative set, while GC-content matched, lacks the complex sequence structure of real genomic DNA — codon usage patterns, repetitive elements, splice site signals, and the evolutionary CpG depletion signature present across all real sequences. Replacing synthetic negatives with real intergenic sequences from the human genome would provide a more stringent and biologically meaningful evaluation.
Several extensions could strengthen the analysis: a systematic comparison across k-mer sizes (k=3, 4, 5, 6) to identify the optimal resolution for capturing promoter motifs; the addition of CNN or LSTM architectures that preserve positional information lost in the bag-of-words encoding; and cross-species evaluation (training on human, testing on mouse or Drosophila) to assess the evolutionary conservation of learned features. These represent natural next steps toward a preprint-quality contribution.
Key Takeaways
- Experimental design matters more than model choice. The decision to GC-match the negative set — and the discovery that synthetic negatives still introduce artifacts — had a bigger impact on what the models learned than the choice between Logistic Regression, SVM, or Random Forest.
- Interpretability reveals limitations. Without feature importance analysis, the 97% F1 score would look like an unqualified success. The coefficient directionality analysis exposed that part of the signal is real-vs-synthetic, not promoter-vs-non-promoter — a finding that only emerges when you look inside the model.
- Cross-model agreement validates biological relevance. When two fundamentally different models (linear and tree-based) converge on the same important features, the signal is more likely to be genuine rather than an artifact of a particular model's inductive bias.
- Classical ML remains a powerful baseline for genomics. Before reaching for deep learning, k-mer encoding with well-tuned classical models achieves strong performance and full interpretability — a combination that neural networks rarely offer.